Exploratory Data Analysis and Visualization


Lecture 03

January 28, 2026

Review

Probability Fundamentals

  • Bayesian vs. Frequentist Interpretations
  • Distributions reflect assumptions on probability of data.
  • Normal distributions: “least informative” distribution for a given mean/variance.
  • Fit distributions by maximizing likelihood.
  • Communicating uncertainty: confidence vs. predictive intervals.

Exploratory Data Analysis

You Can Always Fit Models…

But not all models are theoretically justifiable.

Ian Malcolm meme

Some Implications of Mis-Specification

  • Biased estimates (expected value from the model does not match “true” expected value);
  • Incorrect inferences or inappropriate understandings of relationships/causality.
  • Over/under-confident risk assessments.

Data Generation Approximates Reality

Estimand Estimator Cake

Estimand Estimator Cake

Estimate Cake

Source: Richard McElreath
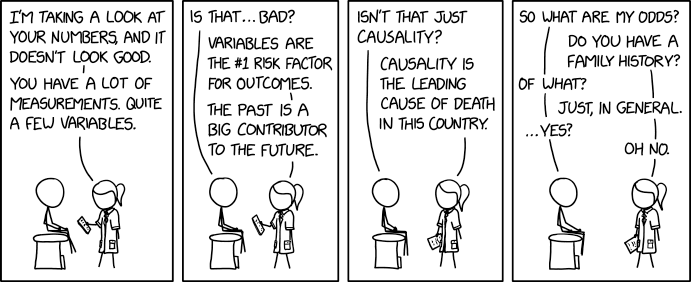
How Do We Choose What To Model?

XKCD 2620

Source: XKCD 2620

How Do We Choose What To Model?

Developing suitable models often starts with both exploratory data analysis (EDA) and theoretical reasoning.

  1. EDA: examining patterns/relationships with visual (plots, clustering) or quantitative (correlations).
  2. Theory: Avoids “data dredging” or “mining,” which can find spurious correlations or patterns which are misleading without broader context about data-generating mechanisms.

Exploratory Data Analysis

  • Will see many examples of this throughout the semester.
  • Try to impose as few assumptions as possible.
  • Goal of exploratory analysis is to get a high-level view of the data and formulate hypotheses/check if data is fit for purpose.

EDA Questions

EDA is about generating questions and identifying if the data quality is sufficient to address them.

Common questions to guide EDA:

  1. What type of variability occurs within my variables?
  2. What type of covariation occurs between my variables?

Common EDA Questions

  • What is the range of the data? What are “typical” values?
  • What values are rare? Do they make sense?
  • Are there missing data or strange outliers? What might explain them?
  • Is a particular relationship or distribution supported by the data?

Common EDA Approaches

  • Data summaries (quantiles, mean/median, max/min, etc.)
  • Correlations
  • Plot data (from multiple perspectives)
  • Clustering (do you need multiple models?)

Example: NY Air Quality Dataset

Code
aq = DataFrame(CSV.File("data/airquality/airquality.csv"))
rename!(aq, :"Solar.R" => :Solar) # rename solar radiation column to get rid of period
aq[1:5, :]
5×7 DataFrame
Row rownames Ozone Solar Wind Temp Month Day
Int64 Int64? Int64? Float64 Int64 Int64 Int64
1 1 41 190 7.4 67 5 1
2 2 36 118 8.0 72 5 2
3 3 12 149 12.6 74 5 3
4 4 18 313 11.5 62 5 4
5 5 missing missing 14.3 56 5 5

Quantitative EDA: Summaries

Code
aq_stack = stack(aq, 2:5)
aq_gp = @groupby(aq_stack, :variable)
@combine(aq_gp, $AsTable = (
        min=minimum(skipmissing(:value)), 
        median=median(skipmissing(:value)),
        mean=mean(skipmissing(:value)),
        max=maximum(skipmissing(:value)),
        missings=sum(ismissing.(:value))
    )
)
4×6 DataFrame
Row variable min median mean max missings
String Float64 Float64 Float64 Float64 Int64
1 Ozone 1.0 31.5 42.1293 168.0 37
2 Solar 7.0 205.0 185.932 334.0 7
3 Wind 1.7 9.7 9.95752 20.7 0
4 Temp 56.0 79.0 77.8824 97.0 0

Quantitative EDA: Correlations

Code
aq_cor = cor(Matrix(dropmissing(aq[:, 2:5])))
DataFrame(aq_cor, names(aq[:, 2:5]))
4×4 DataFrame
Row Ozone Solar Wind Temp
Float64 Float64 Float64 Float64
1 1.0 0.348342 -0.612497 0.698541
2 0.348342 1.0 -0.127183 0.294088
3 -0.612497 -0.127183 1.0 -0.49719
4 0.698541 0.294088 -0.49719 1.0

Visual EDA

Anscombe’s Quartet

Four datasets, all with the same means, variances, correlations, and regression lines.

Shows the importance of visualization!

Anscombe’s Quartet

Source: Wikipedia

Visualizations for EDA

  • Often useful to start with scatterplots: one variable (typically independent) on the \(x\)-axis, another (typically dependent) on the \(y\)-axis.
  • Time series: time always goes on the \(x\)-axis.
  • Boxplots for comparison quantiles/ranges of variables or groups of data.
  • Q-Q Plots to look for mismatches between distributions and data.

Boxplots vs Histograms

Boxplots: Show quantiles (usually median + 1.5 \(\times\) IQR)

Histogram: See distribution of data.

Code
p1 = boxplot(skipmissing(aq[!, :Ozone]), ylabel="Ozone (ppb)")

p2 = histogram(skipmissing(aq[!, :Ozone]), xlabel="Ozone (ppb)", ylabel="Count")

p = plot(p1, p2, layout=(2, 1), size=(550, 500))
Figure 1: Paired plots of air quality dataset

Scatterplots

Code
# this uses the dataframe plotting syntax from StatsPlots.jl
p1 = @df aq scatter(:Ozone, :Solar, markersize=5, color=:blue, xlabel="Ozone (ppb)", ylabel="Solar Radiation (lang)", leftmargin=10mm)
p2 = @df aq scatter(:Ozone, :Wind, markersize=5, color=:blue, xlabel="Ozone (ppb)", ylabel="Wind Speed (mph)", leftmargin=10mm)
p3 = @df aq scatter(:Ozone, :Temp, markersize=5, color=:blue, xlabel="Ozone (ppb)", ylabel="Max Temperature (°F) ", leftmargin=10mm)

p = plot(p1, p2, p3, layout=(1, 3), size=(1100, 400))

Figure 2: Paired plots of air quality dataset

Fit Distributions and Compare to Histograms

If we have a candidate distribution, we can try to fit it to the data and visually compare to a histogram.

Code
# normalize=:pdf turns the y-axis from a raw count to a density to make more comparable with a PDF
pozone = histogram(skipmissing(aq[!, :Ozone]), xlabel="Ozone (ppb)", ylabel="Density", normalize=:pdf, label="Data", size=(600, 450), rightmargin=5mm)
xlims!(pozone, (0, 300))
Figure 3: Histogram of Ozone measurements in Air Quality Dataset

Fit Distributions and Compare to Histograms

Here we might try a Log-Normal distribution.

Code
d = fit(LogNormal, collect(skipmissing(aq[!, :Ozone])))
Distributions.LogNormal{Float64}(μ=3.418515100812007, σ=0.8654745374223664)
Code
ln_samps = rand(d, 5_000)
density!(pozone, ln_samps, linewidth=3, color=:red, label="LogNormal Density")
Figure 4: Histogram of Ozone measurements in Air Quality Dataset

Q-Q Plots

One exploratory method to see if your data is reasonably described by a theoretical distribution is a Q-Q plot.

Code
samps = rand(Normal(0, 3), 20)
qqplot(Normal, samps, linewidth=3, markersize=6)
xlabel!("Theoretical Quantiles")
ylabel!("Empirical Quantiles")
plot!(size=(500, 450))
Figure 5

Q-Q Plots: Data Overdispersed

Figure 6: Diagnosing Problems With Q-Q Plots

Q-Q Plots: Data Underdispersed

Figure 7: Diagnosing Problems With Q-Q Plots

Q-Q Plots: Data Skewed

Figure 8: Diagnosing Problems With Q-Q Plots

Q-Q Plots: Data Biased

Figure 9: Diagnosing Problems With Q-Q Plots

Q-Q Plots With Fitted Distributions

(a) Normal vs Cauchy Distribution
(b) Q-Q Plot
Figure 10: Q-Q Plot for Cauchy Data and Normal Distribution

Ozone Data: LogNormal Fit

Code
p1 = qqplot(LogNormal, collect(skipmissing(aq[!, :Ozone])), linewidth=3, markersize=6, title="Log-Normal Q-Q Plot", leftmargin=5mm)
xlabel!(p1, "Theoretical Values")
ylabel!(p1, "Empirical Values")
plot!(pozone, xlims=(0, 300))
p3 = boxplot([ln_samps[1:116] collect(skipmissing(aq[!, :Ozone]))], xlabel="Ozone (ppb)")
xticks!(p3, [1, 2], ["LogNormal", "Ozone Data"])
plot(p1, pozone, p3, layout=(1, 3), size=(1250, 525), rightmargin=5mm, leftmargin=5mm)

Figure 11: QQ Plot comparing ozone data with LogNormal distribution

Key Points

EDA

  • EDA: Understand structure of data while making as few assumptions as possible (e.g. look at the raw data, not “smoothed” versions).
  • Need to be willing to ask many questions of your data: most won’t make sense once you look at the data.
  • You might be asking the “right” questions but have the “wrong” data: be open-minded and rely on domain knowledge.

Visual EDA

  • Need to experiment with different visualizations.
  • Think about whether you think the distribution of the data is meaningful at this stage.
  • Can draw samples from a fitted distribution and compare (Q-Q plots, boxplots, histograms, etc).
  • Look at multiple plots: they each reveal different features!

Upcoming Schedule

Next Classes

Friday: Data Visualization

Next Week: Linear Regression and Fitting Models

Assessments

Homework 1 Due Friday, 2/6.

Exercises: This week’s involves some simple computations.

Reading: Franconeri et al (2024): long review, recommend starting early!

References

References (Scroll for Full List)