Lecture 12
February 20, 2026
Dependence: History or sequencing of the data matters
\[p(y_t) = f(y_1, \ldots, y_{t-1})\]
Serial dependence captured by autocorrelation:
\[\varsigma(i) = \rho(y_t, y_{t-i}) = \frac{\text{Cov}[y_t, y_{t-i}]}{\mathbb{V}[y_t]} \]
Use partial autocorrelation to diagnose autoregressive orders.
AR(1):
\[ \begin{align*} y_t &= \alpha + \rho y_{t-1} + \varepsilon_t \\ \varepsilon &\sim \mathcal{D}(\theta) \\ y_0 &\sim \mathcal{G}(\psi) \end{align*} \]
\(\mathbb{E}[\varepsilon] = 0\), \(\text{cor}(\varepsilon_i, \varepsilon_j) = 0\), \(\text{cor}(\varepsilon_i, y_0) = 0\)
A time series \(y_t\) is weakly stationary if \(\mathbb{E}[Y_t] = \mathbb{E}[Y_{t+1}]\) and \(\text{Cov}(Y_1, Y_k) = \text{Cov}(Y_t, Y_{t+k-1})\).
The conditional variance \(\mathbb{V}[y_t | y_{t-1}] = \sigma^2\).
Unconditional variance for stationary \(\mathbb{V}[y_t]\):
\[ \begin{align*} \mathbb{V}[y_t] &= \rho^2 \mathbb{V}[y_{t-1}] + \mathbb{V}[\varepsilon] \\ &= \rho^2 \mathbb{V}[y_t] + \sigma^2 \\ &= \frac{\sigma^2}{1 - \rho^2}. \end{align*} \]
Need \(\mathbb{E}[Y_t] = \mathbb{E}[Y_{t-1}]\) and \(\mathbb{V}[Y_t] = \mathbb{V}[Y_{t-1}]\). If we want this to hold:
\[\begin{aligned} \mathbb{E}[Y_t] &= \mathbb{E}[\alpha + \rho Y_{t-1} + \varepsilon_t] \\ &= \alpha + \mathbb{E}[Y_{t-1}] + \cancel{\mathbb{E}[\varepsilon_t]} \\[0.75em] \Rightarrow \mathbb{E}[Y_t] &= \alpha + \rho \mathbb{E}[Y_t] \\ &= \frac{\alpha}{1-\rho}. \end{aligned}\]
Now for the variance:
\[\begin{aligned} \mathbb{V}[Y_t] = \mathbb{V}[\alpha + \rho Y_{t-1} + \varepsilon_t] \\ &= \rho^2 \mathbb{V}[Y_{t-1}] + \cancel{2\text{Cov}(Y_{t-1}, \varepsilon_t)} + \mathbb{V}[\varepsilon_t] \\[0.75em] \Rightarrow \mathbb{V}[Y_t] &= \rho^2 \mathbb{V}[Y_t] + \sigma^2 \\ &= \frac{\sigma^2}{1 - \rho^2}. \end{aligned}\]
Thus the AR(1) is stationary if and only if \(|\rho| < 1\).
Think about deterministic version (set \(\alpha = 0\) to simplify):
\[ y_t = \rho y_{t-1} = \rho^t y_0 \]
Stationarity: \[|\rho| < 1 \Rightarrow \lim_{t \to \infty} \rho^t = 0.\]
Stationary AR(1)s will decay to 0 on average and non-stationary will diverge to \(\pm \infty\).
Innovations/noise continually perturb away from this long-term deterministic path.
ρ = 0.7
σ = 0.2
ar_var = sqrt(σ^2 / (1 - ρ^2))
T = 100
ts_det = zeros(T)
n = 3
ts_stoch = zeros(T, n)
t0 = 1.5
for i = 1:T
if i == 1
ts_det[i] = t0
ts_stoch[i, :] .= t0
else
ts_det[i] = ρ * ts_det[i-1]
ts_stoch[i, :] = ρ * ts_stoch[i-1, :] .+ rand(Normal(0, σ), n)
end
end
p = plot(1:T, ts_det, label="Deterministic", xlabel="Time", linewidth=3, color=:black, size=(600, 550))
cols = ["#DDAA33", "#BB5566", "#004488"]
for i = 1:n
label = i == 1 ? "Stochastic" : false
plot!(p, 1:T, ts_stoch[:, i], linewidth=1, color=cols[i], label=label)
end
pAssume stationarity and zero-mean process (\(\alpha = 0\)).
Need to know \(\text{Cov}[y_t, y_{t-h}]\) for arbitrary \(h\).
\[ \begin{align*} \text{Cov}[y_t, y_{t-h}] &= \text{Cov}[\rho^h y_{t-h}, y_{t-h}] \\ &= \rho^h \text{Cov}[y_{t-h}, y_{t-h}] \\ &= \rho^h \frac{\sigma^2}{1-\rho^2} \end{align*} \]
\[ \begin{align*} \mathbf{y} &\sim \mathcal{N}(\mathbf{\mu}, \Sigma) \\ \Sigma &= \frac{\sigma^2}{1 - \rho^2} \begin{pmatrix}1 & \rho & \ldots & \rho^{T-1} \\ \rho & 1 & \ldots & \rho^{T-2} \\ \vdots & \vdots & \ddots & \vdots \\ \rho^{T-1} & \rho^{T-2} & \ldots & 1\end{pmatrix} \end{align*} \]
where \(\mu = \frac{\alpha}{1 - \rho}\).
An “easier approach” (often more numerically stable) is to whiten the series sample/compute likelihoods in sequence.
Calculate whitened residuals \[r_t = y_t - \left(\alpha + \rho * y_{t-1}\right).\]
\[ \begin{align*} y_0 & \sim N\left(\frac{\alpha}{1 - \rho}, \frac{\sigma^2}{1 - \rho^2}\right) \\ r_t &\sim N(0, \sigma^2) \end{align*} \]
function ar1_loglik_whitened(θ, dat)
# might need to include mean or trend parameters as well
# subtract trend from data to make this mean-zero in this case
α, ρ, σ = θ
T = length(dat)
ll = 0 # initialize log-likelihood counter
for i = 1:T
if i == 1
ll += logpdf(Normal(α / (1 - ρ), sqrt(σ^2 / (1 - ρ^2))), dat[i])
else
r = dat[i] - (α + ρ * dat[i-1])
ll += logpdf(Normal(0, σ), r)
end
end
return ll
end
function ar1_loglik_joint(θ, dat)
# might need to include mean or trend parameters as well
# subtract trend from data to make this mean-zero in this case
α, ρ, σ = θ
T = length(dat)
# compute all of the pairwise lags
# this is an "outer product"; syntax will differ wildly by language
H = abs.((1:T) .- (1:T)')
P = ρ.^H # exponentiate ρ by each lag
Σ = σ^2 / (1 - ρ^2) * P
ll = logpdf(MvNormal((α / (1 - ρ)) .+ zeros(T), Σ), dat)
return ll
endα = 0.1
ρ = 0.6
σ = 0.25
T = 50
ts_sim = zeros(T)
# simulate synthetic AR(1) series
for t = 1:T
if t == 1
ts_sim[t] = rand(Normal(0, sqrt(σ^2 / (1 - ρ^2))))
else
ts_sim[t] = α + rand(Normal(ρ * ts_sim[t-1], σ))
end
end
plot(1:T, ts_sim, linewidth=3, xlabel="Time", ylabel="Value", title=L"$α = 0.1, ρ = 0.6, σ = 0.25$")
plot!(size=(600, 500))lb = [-5.0, -0.99, 0.01]
ub = [5.0, 0.99, 5]
init = [0.0, 0.6, 0.3]
optim_whitened = Optim.optimize(θ -> -ar1_loglik_whitened(θ, ts_sim), lb, ub, init)
θ_wn_mle = round.(optim_whitened.minimizer; digits=2)
@show θ_wn_mle;
optim_joint = Optim.optimize(θ -> -ar1_loglik_joint(θ, ts_sim), lb, ub, init)
θ_joint_mle = round.(optim_joint.minimizer; digits=2)
@show θ_joint_mle;θ_wn_mle = [0.12, 0.5, 0.22]
θ_joint_mle = [0.12, 0.5, 0.22]
\[y_t = \underbrace{x_t}_{\text{fluctuations}} + \underbrace{z_t}_{\text{trend}}\]
Spectral analysis: Based on Fourier decomposition to switch between time domain and frequency domain.
The resulting important frequencies can be used in a regression \[y_t = A \cos(\omega t) + B \sin(\omega t) + C + \varepsilon_t\]
where \(\varepsilon_t\) has a Gaussian or AR model.
function load_data(fname)
date_format = "yyyy-mm-dd HH:MM"
# this uses the DataFramesMeta package -- it's pretty cool
return @chain fname begin
CSV.File(; dateformat=date_format)
DataFrame
DataFrames.rename(
"Time (GMT)" => "time", "Predicted (m)" => "harmonic", "Verified (m)" => "gauge"
)
@transform :datetime = (Date.(:Date, "yyyy/mm/dd") + Time.(:time))
select(:datetime, :gauge, :harmonic)
@transform :weather = :gauge - :harmonic
@transform :month = (month.(:datetime))
end
end
dat = load_data("data/surge/norfolk-hourly-surge-2015.csv")
p1 = plot(dat.datetime, dat.gauge; ylabel="Gauge Measurement (m)", label="Observed", legend=:topleft, xlabel="Date/Time", bottom_margin=5mm, left_margin=5mm, right_margin=5mm, size=(500, 500))T = nrow(dat) # get number of samples (this is hourly in this case), so 8760
ps = DSP.periodogram(dat.gauge) # compute periodogram with T sampling frequency
plot(ps.freq, ps.power, xlabel="Frequency", ylabel="Log-Power Spectrum", legend=false, linewidth=3, yaxis=:log, size=(500, 500))
vline!([0, .0805], color=:red, linestyle=:dash, lw=1)The biggest spikes are at frequency 0 (no period; this is just a drift without harmonic behavior) and frequency 0.0805.
Since the data is sampled hourly over one year, the period is \(0.0805 \times 8760 \approx 705\) hours, or \(\approx 29\) days.
So might write a model \[y_t \sim A + Bt + C\cos(2\pi(.0805)t) + D\sin(2\pi(.0805)t) + \varepsilon_t\] where \(\varepsilon_t\) is a residual process (could be AR(p)).
For a given set of parameters:
Should do this all within a single likelihood calculation.
Do not estimate trend using a simple regression and then fit the residuals to an AR process.
You could get very different parameter estimates.
Dragons: Extrapolating trends identified using “curve-fitting” is highly fraught, complicating projections.
Better to have an explanatory model and then fit autoregressive models to the residuals…

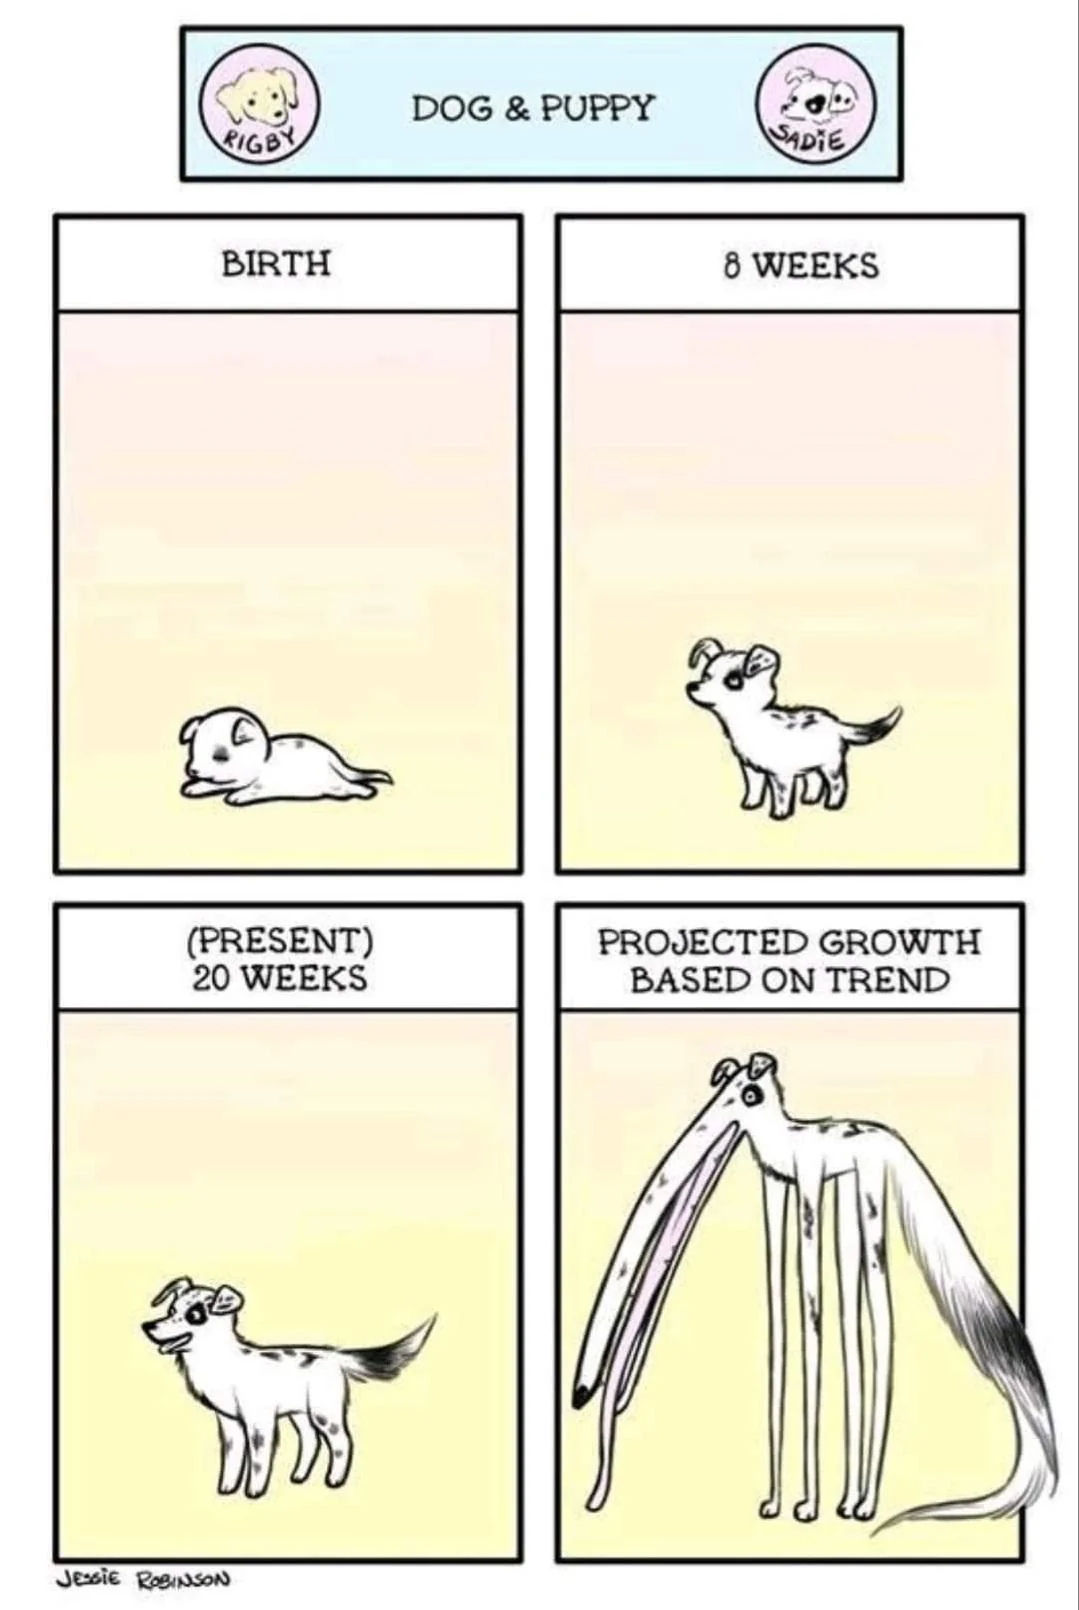
Source: Reddit (original source unclear…)
Figure 7: Global mean sea level and temperature data.
pacf_slr = pacf(sl_dat[!, :GMSLR], 0:5)
p1 = plot(0:5, autocor(sl_dat[!, :GMSLR], 0:5), marker=:circle, line=:stem, linewidth=3, markersize=8, legend=false, ylabel="Autocorrelation", xlabel="Time Lag", size=(550, 500))
p2 = plot(0:5, pacf_slr, marker=:circle, line=:stem, markersize=8, linewidth=3, legend=false, ylabel="Partial Autocorrelation", xlabel="Time Lag", size=(550, 500))
display(p1)
display(p2)Simple model of sea-level rise from Grinsted et al. (2010):
\[\begin{aligned} \frac{dS}{dt} &= \frac{S_\text{eq} - S}{\tau} \\ S_\text{eq} &= aT + b, \end{aligned} \]
Note: Hypothetically this type of model can capture all of the autocorrelation (or at least non-stationarity) in the data, since:
So a good strategy is to try to calibrate this model without assuming AR(1) residuals, then see if they’re necessary (HW3).
Many ways to discretize model, we use the simplest (forward Euler) based on \(\frac{dy}{dx} = \lim_{\Delta x \to 0} \frac{y(x + \Delta x) - y(x)}{\Delta x}\):
\[ \begin{aligned} \frac{S(t+1) - S(t)}{\Delta t} &= \frac{S_\text{eq}(t) - S(t)}{\tau} \\[0.5em] S_\text{eq}(t) &= a T(t) + b, \\[1.5em] \Rightarrow S(t+1) &= S(t) + \Delta t \frac{S_\text{eq}(t) - S(t)}{\tau} \\[0.5em] S_\text{eq}(t) &= a T(t) + b, \end{aligned} \]
We can treat this like any other regression, but use model for \(S(t)\) instead of e.g. linear model:
Assuming i.i.d. Gaussian residuals: \[y_t = S(t) + \varepsilon_t, \qquad \varepsilon_t \sim N(0, \sigma^2)\]
If residuals are autocorrelated: \[y_t = S(t) + \omega_t, \quad \omega_t = \rho \omega_{t-1} + \varepsilon_t, \quad \varepsilon_t \sim N(0, \sigma^2)\]
Next Week: Extreme Values (Theory and Models)
Next Unit: Hypothesis Testing, Model Evaluation, and Comparison
HW2: Due Friday at 9pm.
Exercises and Reading due Monday.
HW3: Assigned on Monday, due 3/6.
Quiz 2: 3/13.